|
Click to listen to this article
|
How Do Irrigation Frequency and Final Irrigation Timing Influence Onion Bacterial Diseases?
By Tessa Belo, Gabriel LaHue, Lindsey du Toit and Tim Waters, Washington State University
Onion bacterial diseases can pose a significant economic threat to growers, as they can lead to crop losses of more than 50 percent under the worst conditions. Previous research has found that overhead irrigation, especially after bulb initiation, and other sources of moisture in the canopy during field curing are risk factors for onion bacterial diseases. Less is known about managing onion bacterial diseases based on the frequency of irrigation during the growing season or through optimizing the timing of the final irrigation. Given that moisture and splashing water are significant drivers of bacterial diseases, strategic irrigation management is a critical and often overlooked part of managing crop losses caused by pathogenic bacteria while maintaining the desired bulb yields.
2020 Irrigation Trials
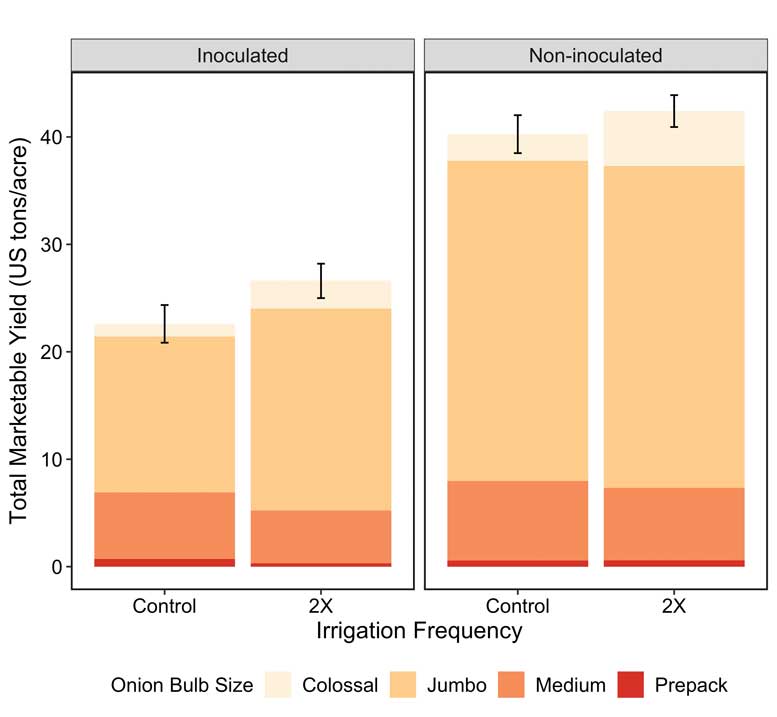
Trials evaluating the effects of irrigation frequency and final irrigation timing were conducted under sprinkler irrigation in Pasco, Washington, using the cultivar Calibra. The irrigation frequency trial was designed to test the hypothesis that more frequent irrigation would exacerbate onion bacterial diseases by comparing the effects of irrigating twice as often (2X) but for shorter time periods to longer, less frequent irrigations (control). The control plots were irrigated when 40 percent of the plant available water in the root zone was depleted, while the 2X treatment plots were irrigated at 20 percent depletion, based on a water balance calculated from publicly available weather data. Irrigation frequency treatments began at the third to fourth leaf stage, after which the 2X plots were watered 59 times and the control plots were watered 35 times, but all plots received just over 19 inches of irrigation total.
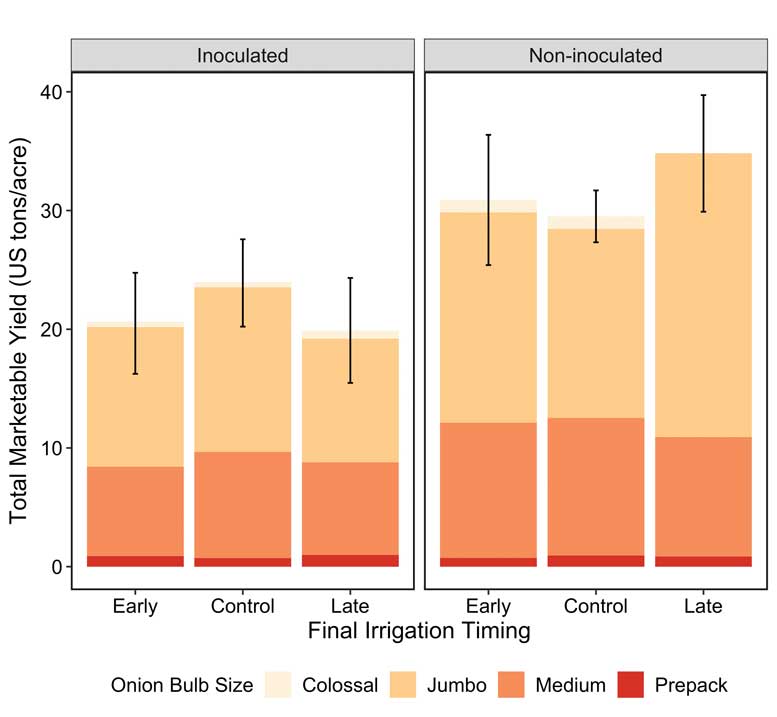
The irrigation cut-off timing trial tested the hypothesis that irrigating later into the growing season would lead to a larger number of bulbs with bacterial rot. This trial compared three irrigation cut-off time points: the control cut-off timing was at approximately 50 percent tops down, the early timing was one week earlier at 5-10 percent tops down, and the late cut-off was one week after the control treatment (93 percent tops down on average).
To ensure that there would be adequate disease pressure, local pathogenic strains of two bacterial pathogens (Burkholderia gladioli pv. allicola and Pantoea agglomerans) were applied to the plots twice at the end of the growing season, at the start of tops falling down and again two weeks later. The bacteria were applied using a CO2-pressurized backpack sprayer to half of each plot so that there were inoculated and non-inoculated sub-plots.
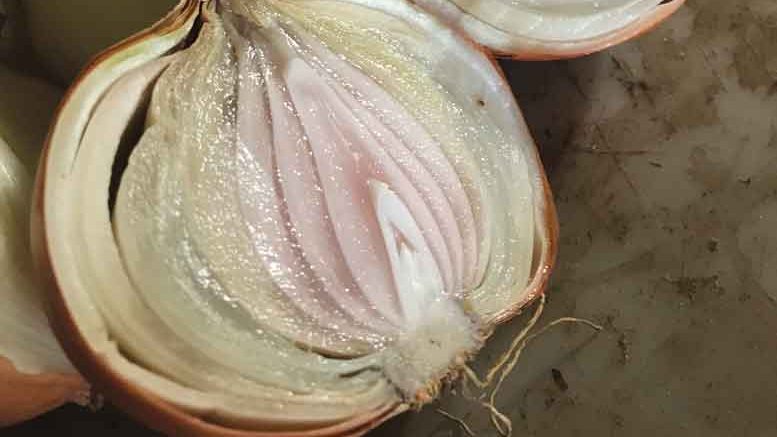
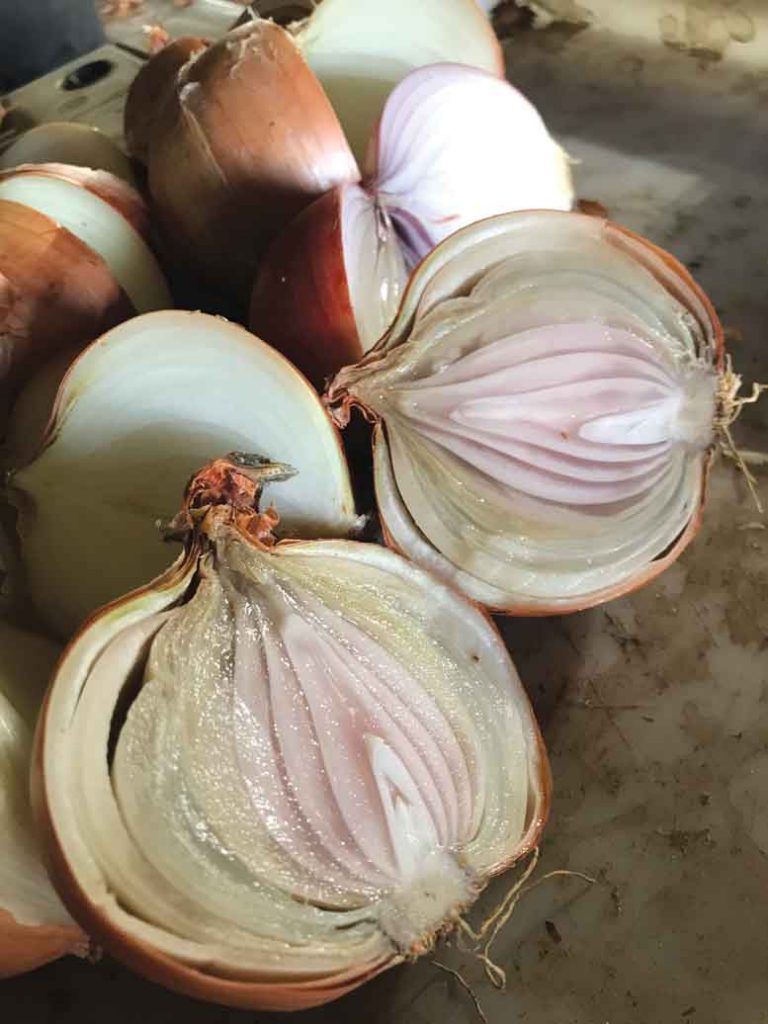
Bulbs were undercut at 90 percent tops down and cured in the field for three weeks. At harvest, bulbs were sorted by size, weighed by size category to determine marketable yield, bagged and stored in a commercial onion storage facility. A sample of approximately 50 onion bulbs from each plot were cut and evaluated for bacterial disease incidence and severity in the fall, shortly after harvest, and again in winter after five months in storage (Fig. 1).
Results, Conclusions
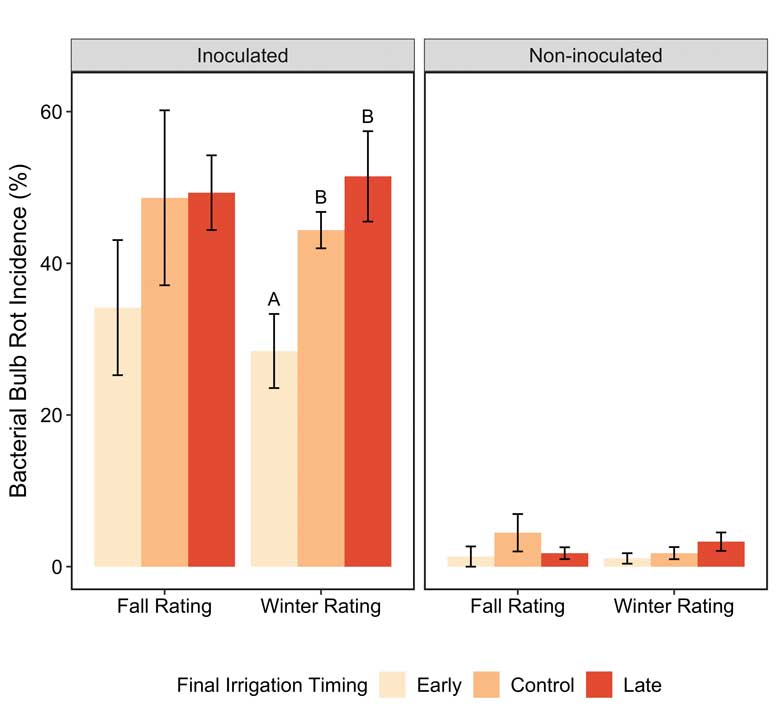
The total marketable yield was not affected by the irrigation frequency treatments (Fig. 2) or the irrigation cut-off treatments (Fig. 3). There was no difference between the two irrigation frequency treatments in bacterial bulb rot incidence at harvest or after five months in storage (Fig. 4). However, the timing of the final irrigation had a significant effect on the number of bulbs with bacterial rot at harvest, with 5 tons/acre of bulbs culled as a result of bacterial rot in inoculated plots in which irrigation was stopped early (5–10 percent tops down) compared to 10 tons/acre of bacterial culls when irrigation was stopped late (93 percent tops down). Bulbs harvested from the early cut-off timing plots also had a lower incidence of bacterial bulb rot after five months of storage compared to bulbs harvested from the control plots and plots that received the late irrigation cut-off timing (28 vs. 44–51 percent; Fig. 5).
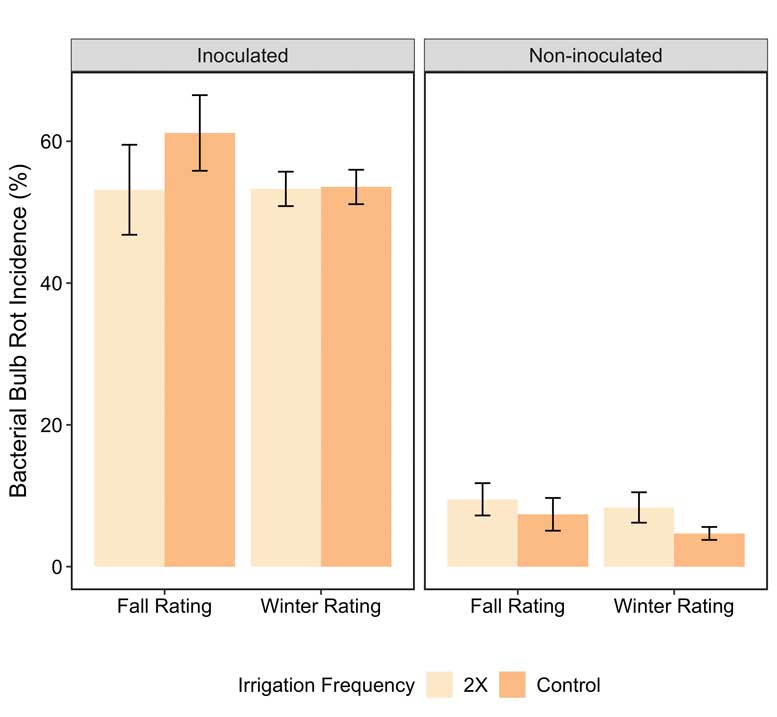
Based on the results from the first year of this study, ending irrigation after the final leaf emerged and when onion plants had an average of 5–10 percent tops down reduced the incidence of bulbs with bacterial rot at harvest and bacterial rot after five months in storage compared to irrigating the crop for two additional weeks. These findings highlight the importance of careful irrigation management at the end of the season in order to reduce losses to bacterial bulb rots, especially under overhead irrigation.
These trials will be repeated in 2021 and 2022, so more data will soon add to our understanding of the role of irrigation management in effectively combating onion bacterial diseases.
Authors’ note: This work is supported by the Specialty Crops Research Initiative Award 2019-51181-30013 from the USDA National Institute of Food and Agriculture. Any opinions, findings, conclusions or recommendations expressed in this publication are those of the authors and do not necessarily reflect the view of the U.S. Department of Agriculture.